Project was part of identifying opportunity for enhancing UX of IG Trading Financial Charting package.
Worked alongside Stakeholders, Product owner and Development team.
Problem statement
We had number of requests from user feedback to add option to select timeframe for chart.
Challenge
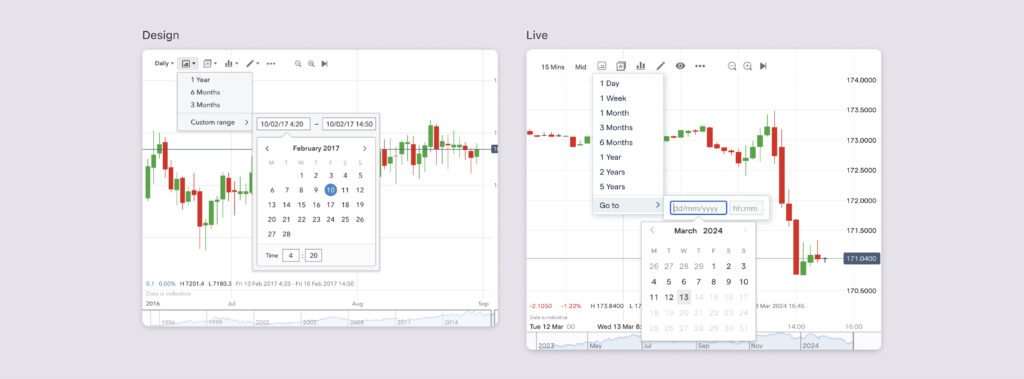
Due to technical limitations on rendering interval candle it was difficult to add from and to dates all together.
Process and results
Conducted internal testing with in-house analysts who use charts for trading analysis to find out why users would want to navigate to particular date and how it is fits to trading journey.
For most going to particular date or to display range between specified date and recent date was enough to satisfy their needs.
Delivered MVP solution ‘from the date’, added more options as 1 Day – 1Year and kept for next phases ‘to the date’.
This feature satisfied user needs and we had tracked more Time range usage than interaction with Timeframe at the bottom of the chart.