My role
Lead designer on a chart project I had consistent customer-centric approach, created seamless cross platform chart experience.
During 9 years of working on product I led and contribute to high-level strategic decisions with how product will grow, set ‘north-star’ vision.
Owned the end-to-end interaction, visual design, ensuring smooth user experience on mobile and web charts.
Process
Worked with analysts on defining needs in chart analysis, which led into creating number of tools and interface enhancements.
Workshop with regional offices on product feature development prioritisation and producing further Financial Charts Vision on web and mobile applications.
The product I create grounded on HCI methodology and use of available customer insight to inform the solution such as customer support, analytics, market and user research, competitor analysis and etc.
Outcomes
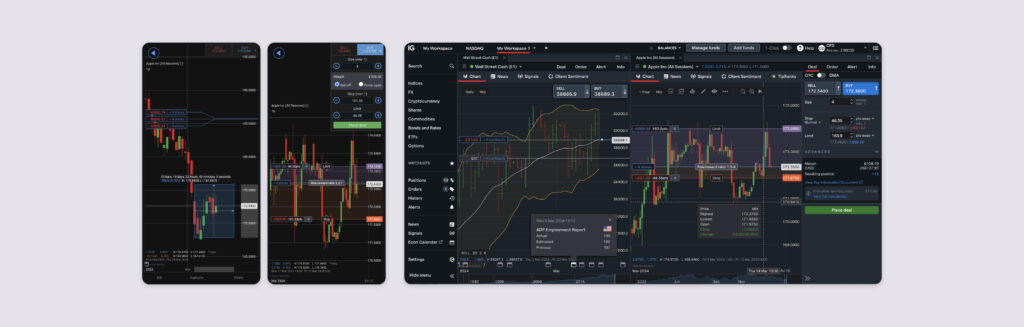
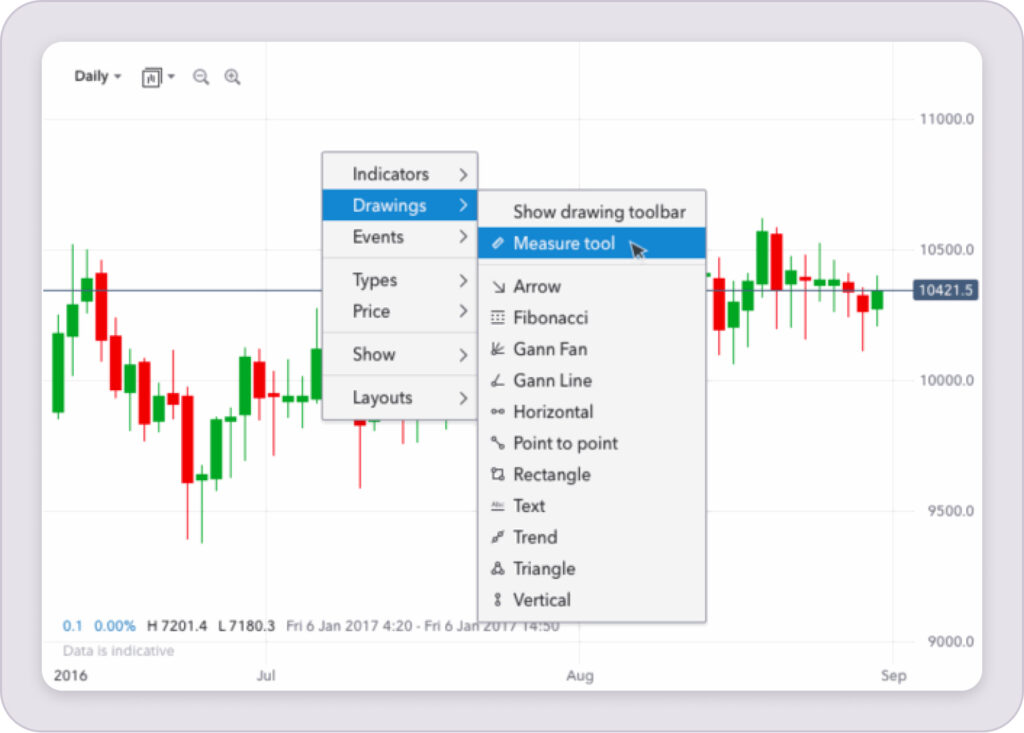
Delivered a robust charting tool for mobile and web with intuitive user interface and comprehensive features, such as advanced drawings and indicators.
Empowered trading professionals to make informed decisions with access to dynamic and customisable financial charts.
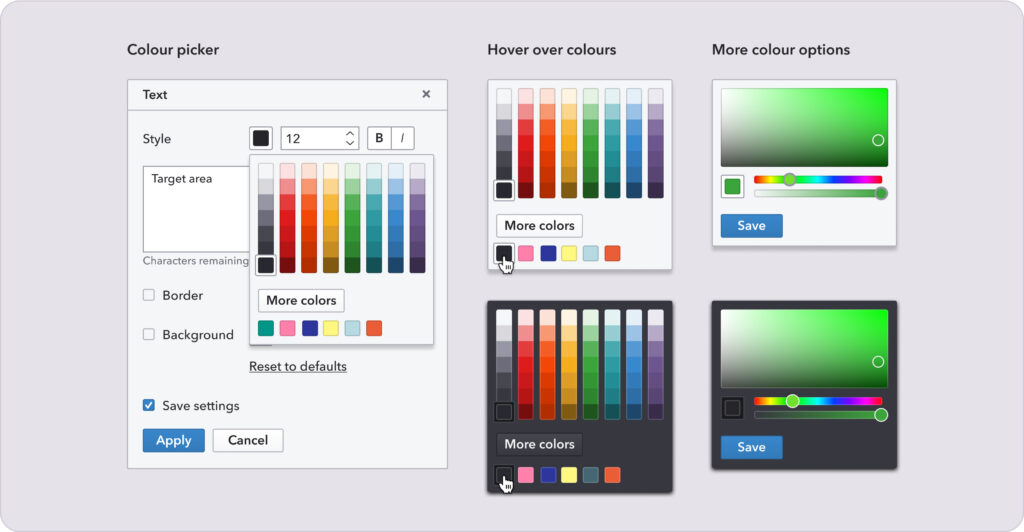
Editing dialog for indicators and drawings. Colour picker interface with predefined IG Brand colours and option to select a new colour from palette
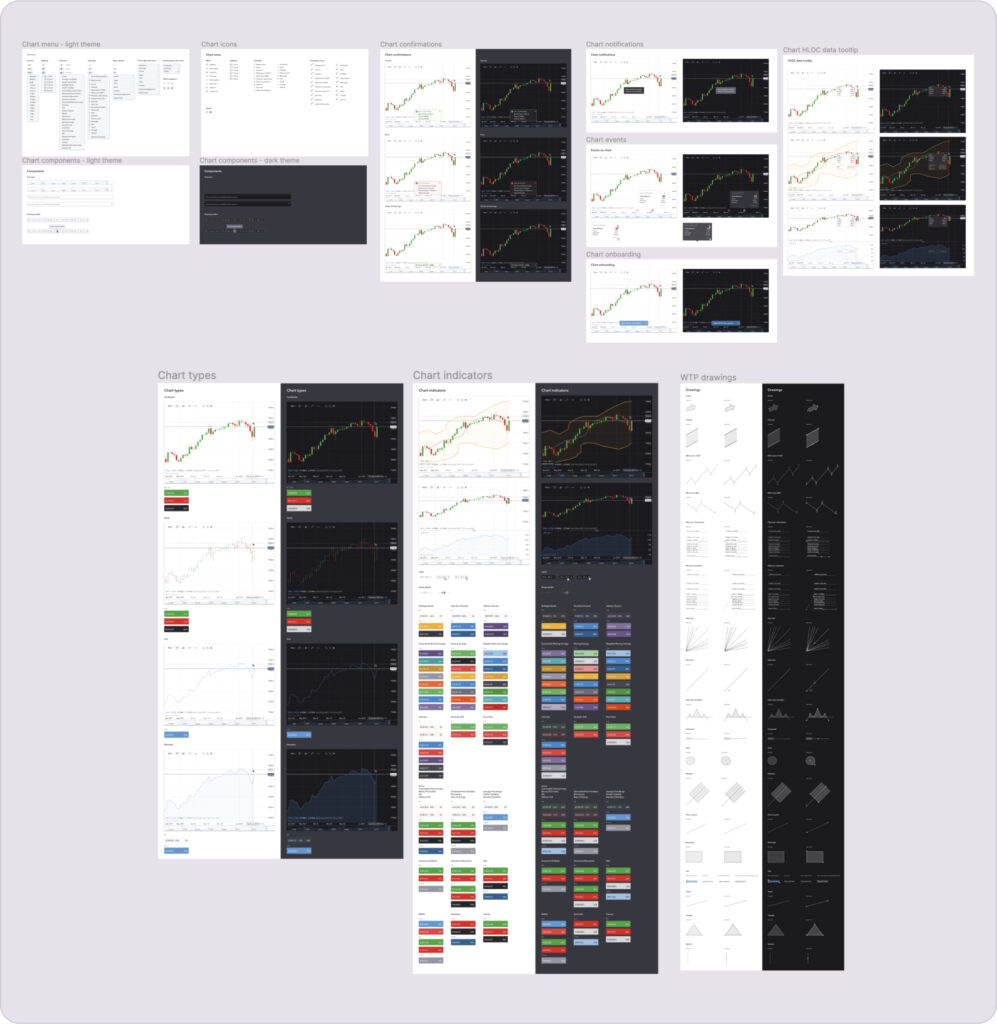
Design System
Created a style guide for financial charts involves establishing a set of design principles, visual elements, and guidelines to ensure consistency and clarity in presenting financial data.
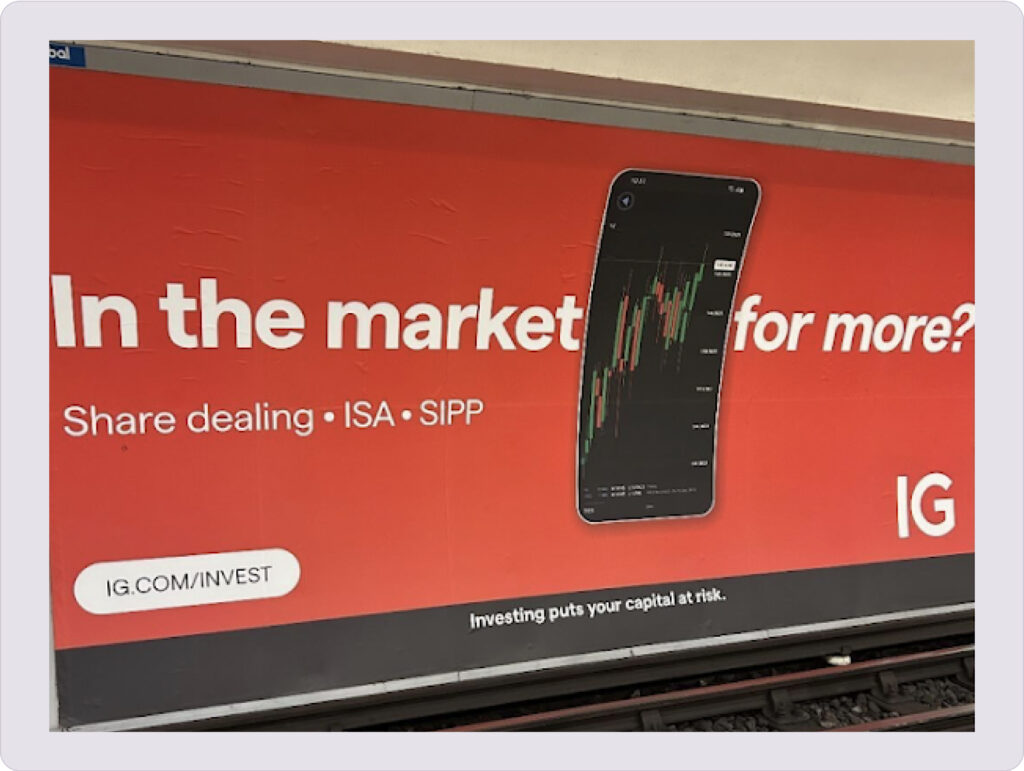
In many IG promotional materials, charts played a central role.
These charts were often highlighted to demonstrate the ease of use and comprehensive data insights available through IG’s trading platforms.
By featuring charts in their marketing campaigns, IG effectively showcased their capabilities in simplifying complex market information, making it accessible to both professional and non-professional traders.
This emphasis on charts helped to attract and engage potential users by visually representing the powerful analytical tools at their disposal.